WHERE IS YOUR DATA?
What Is The
PROBLEM?
Your Data is being tracked.
You are agreeing to being tracked.
Why is that?

WHAT I AM DOING...
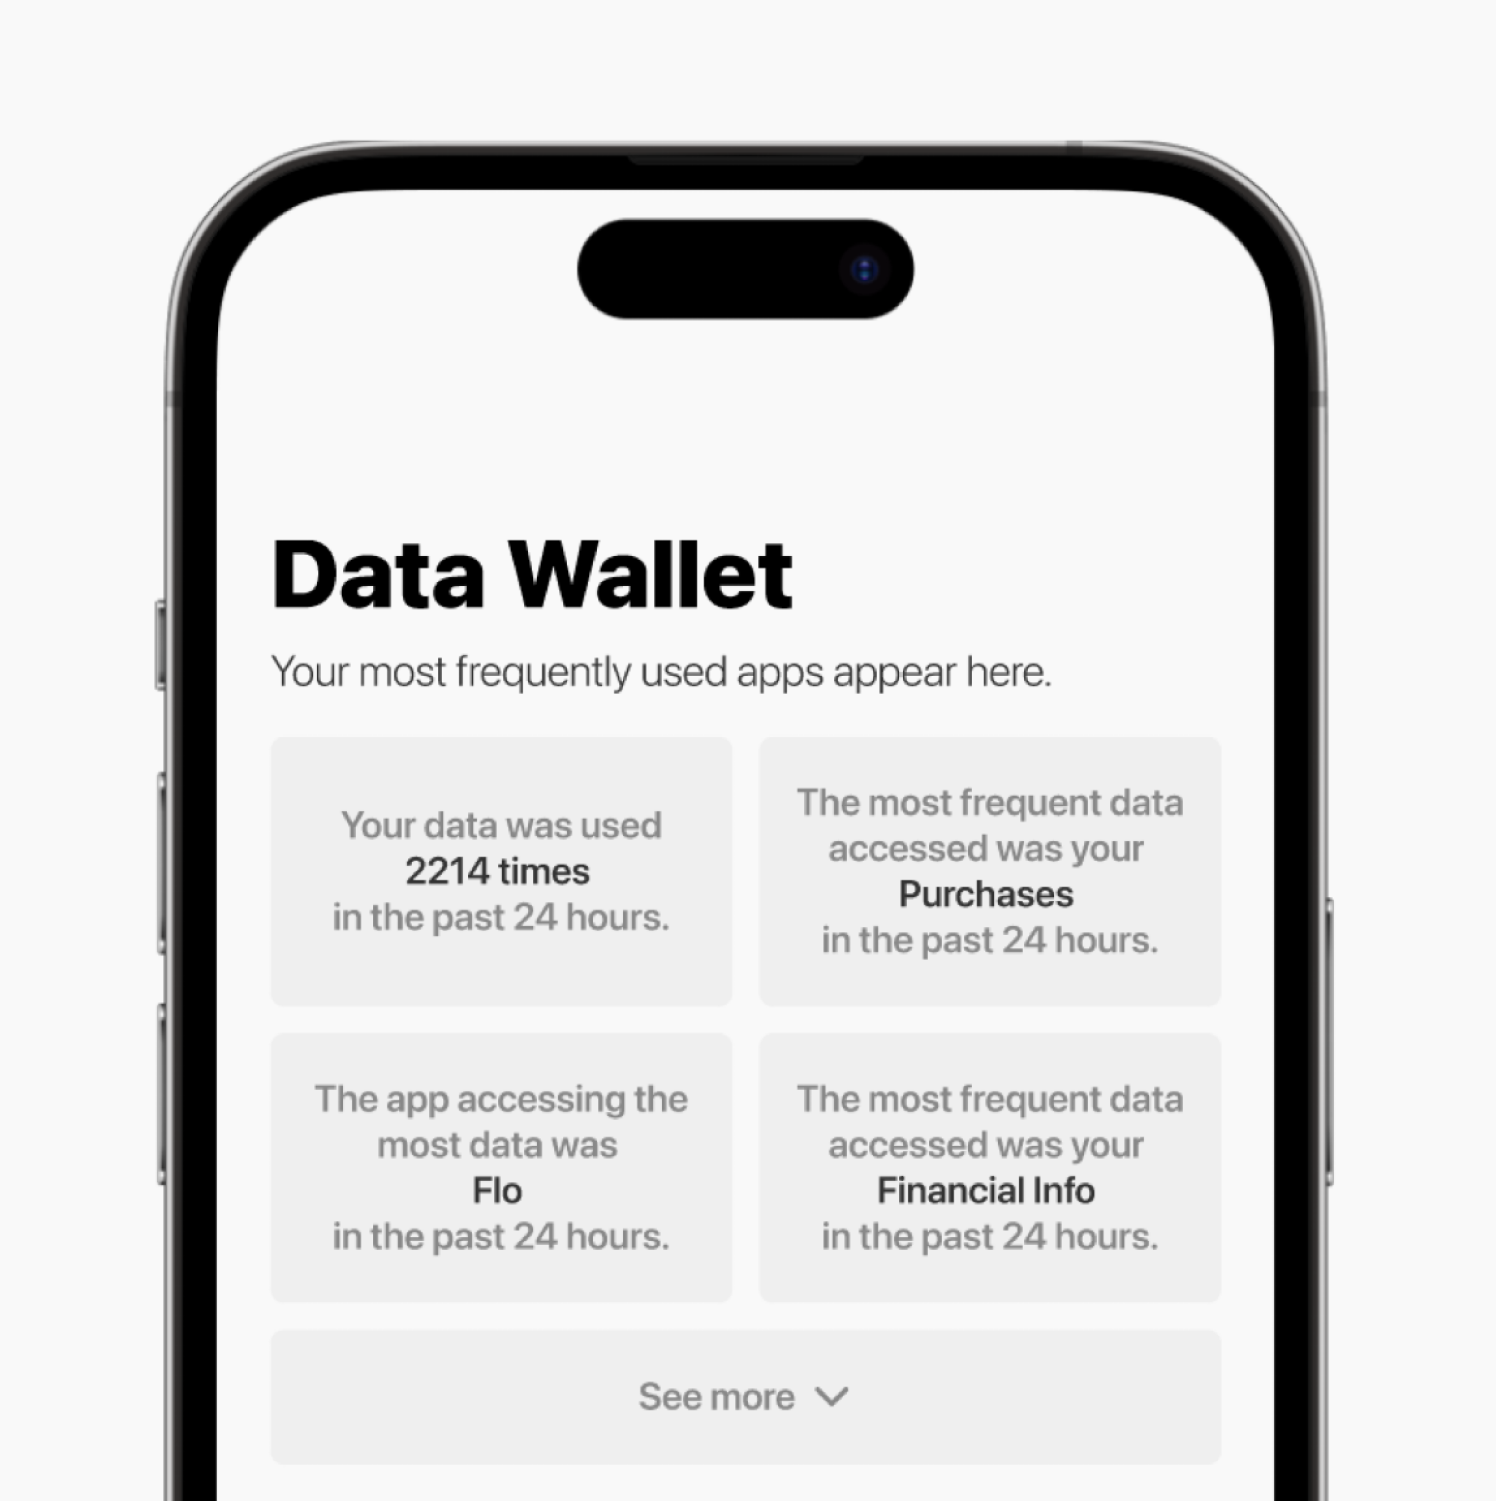
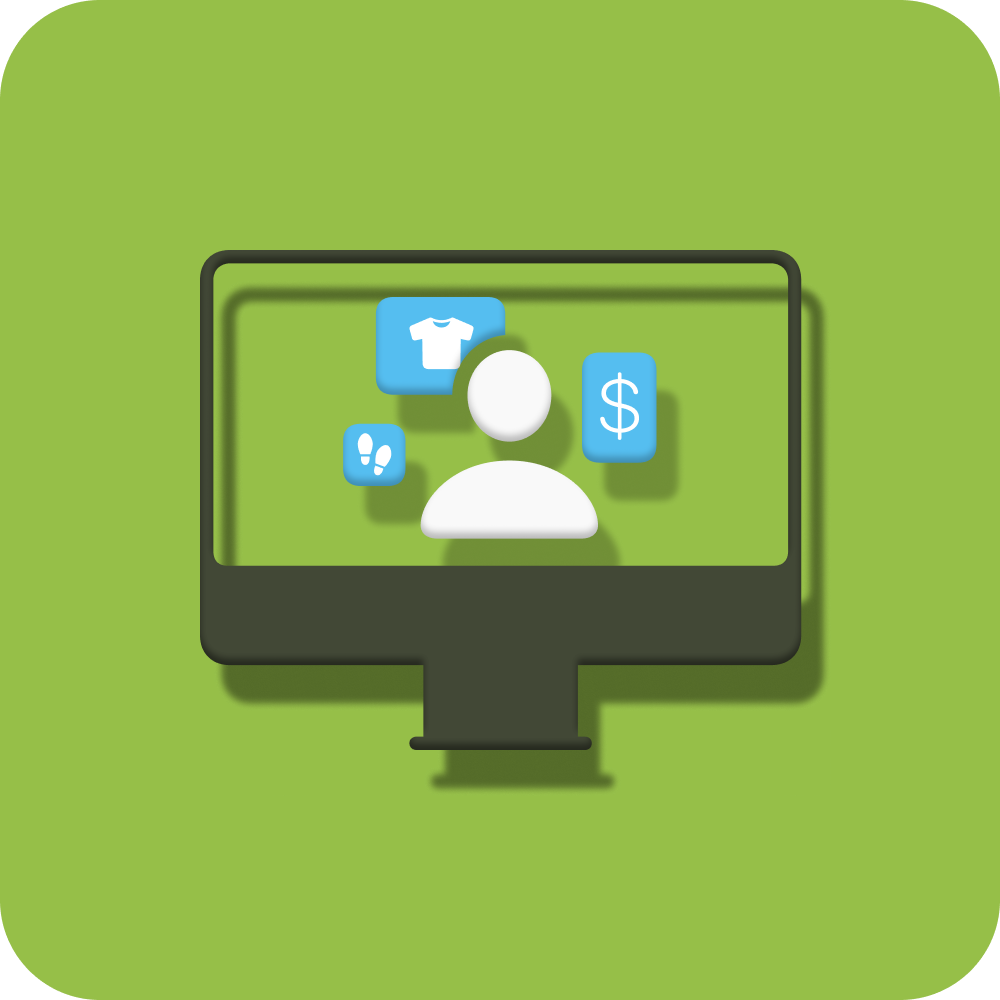
ONE. VISUALIZE DATA
two. TRACK DATA USAGE PER APP
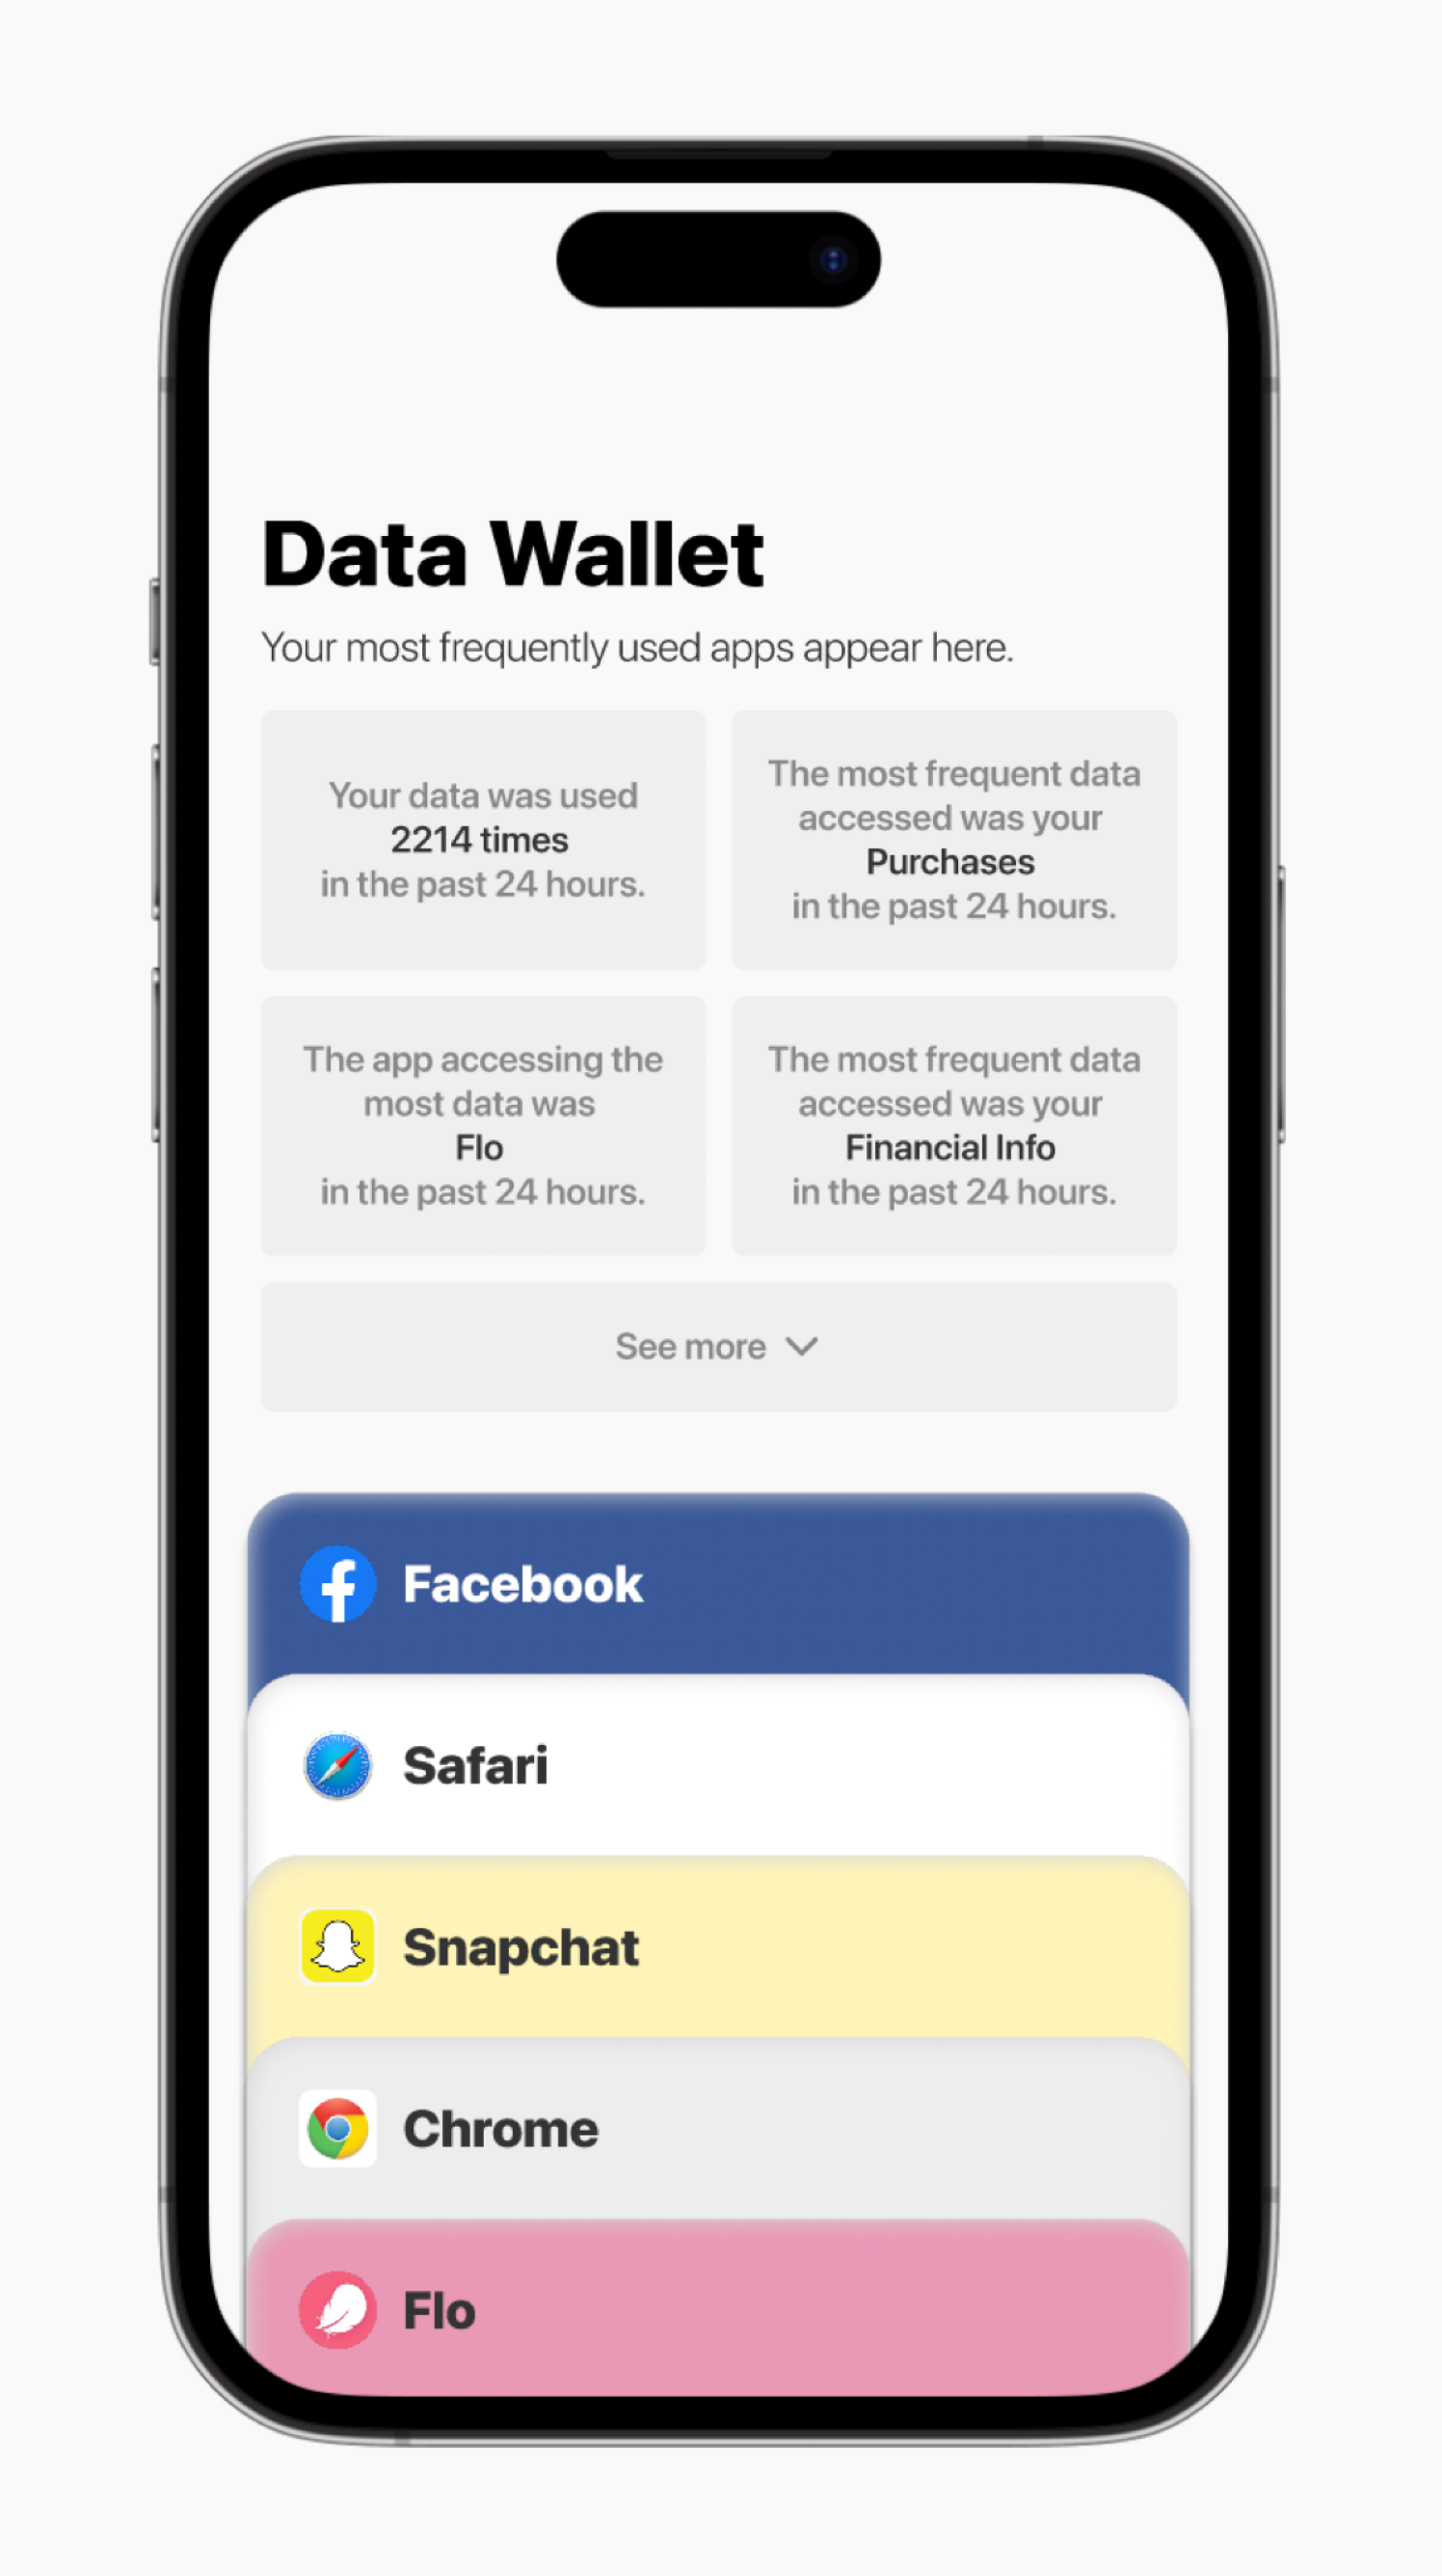
It wasn't very popular among peers.
Comments suggested that the information was not useful or usable.
WHAT I AM DOING...
again
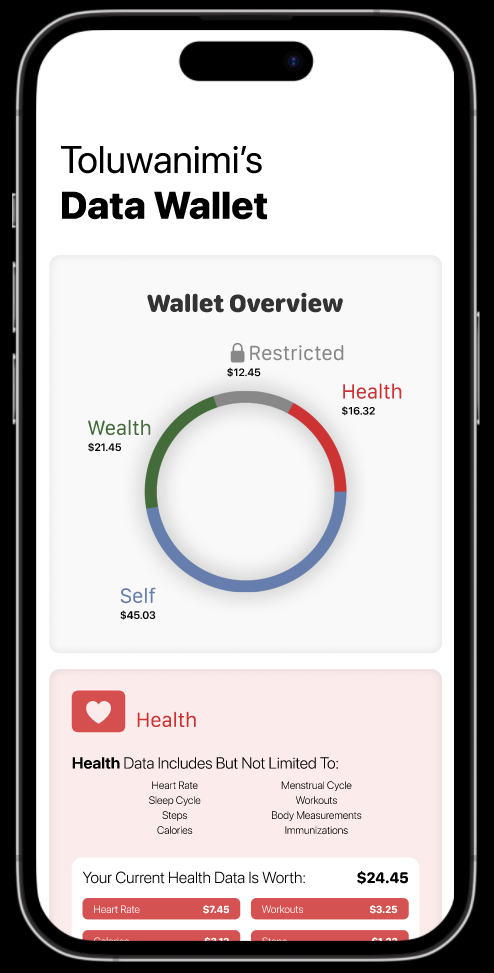
ONE. VISUALIZE DATA (better)
two. add a way to quantify data
ONE. VISUALIZE DATA (better)
- Visualize data in charts rather than figures.
- Split data into different sub-categories.
two. add a way to quantify data
- Added a dollar value to the data, highlighting how much seemingly meaningless datapoints actually have quite a lot of value to those that want it.
Slightly better feedback, but users missed the cards. Let's bring them back.
WHAT I AM DOING...
last time, i swear
ONE. VISUALIZE DATA (mix of prior versions)
two. CLEAn up ui
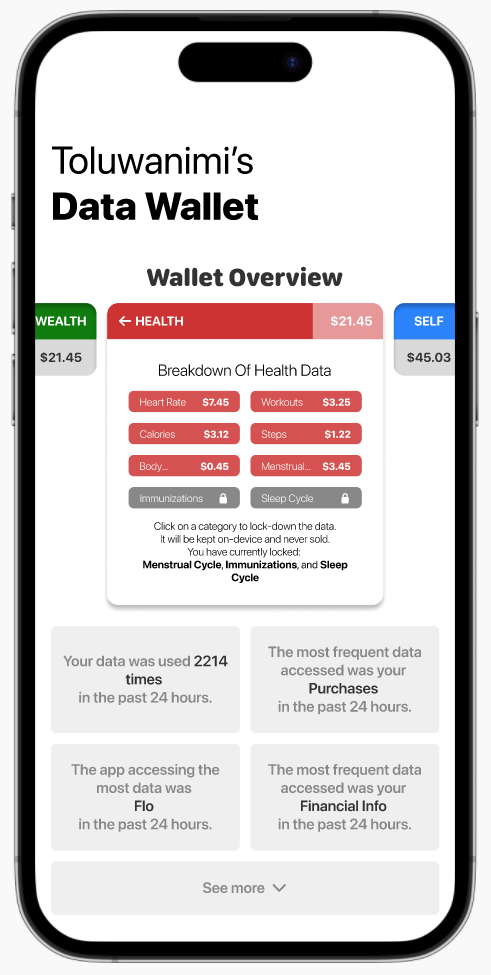
ONE. VISUALIZE DATA (mix of prior versions)
Charts were good, but having a way to see data use and it's value on one page was ideal.
two. clean up ui
Simplified cards and made them fit better on a device screen. Reorganized elements for easier reading.
Even better feedback, but still not perfect.
WHAT Is next...
rebuild from the ground up.
Follow iterative design framework from the start.
Portfolio

IPS 2.0E2E Branding/Website Refresh

Illuminate the Digital LandscapeThesis Project

The Journey of ImperfectionDermatology Case Study

CliffordHospital Case Study

Autonomy in the WorkforceResearch Paper

AlfreshFood Waste Sprint
DwellShopify Sprint
#OwnYourDataThesis Preparation

F(AR)MDeviancy Exploration
made with  and
and  in port moody, bc